

Kitsap County

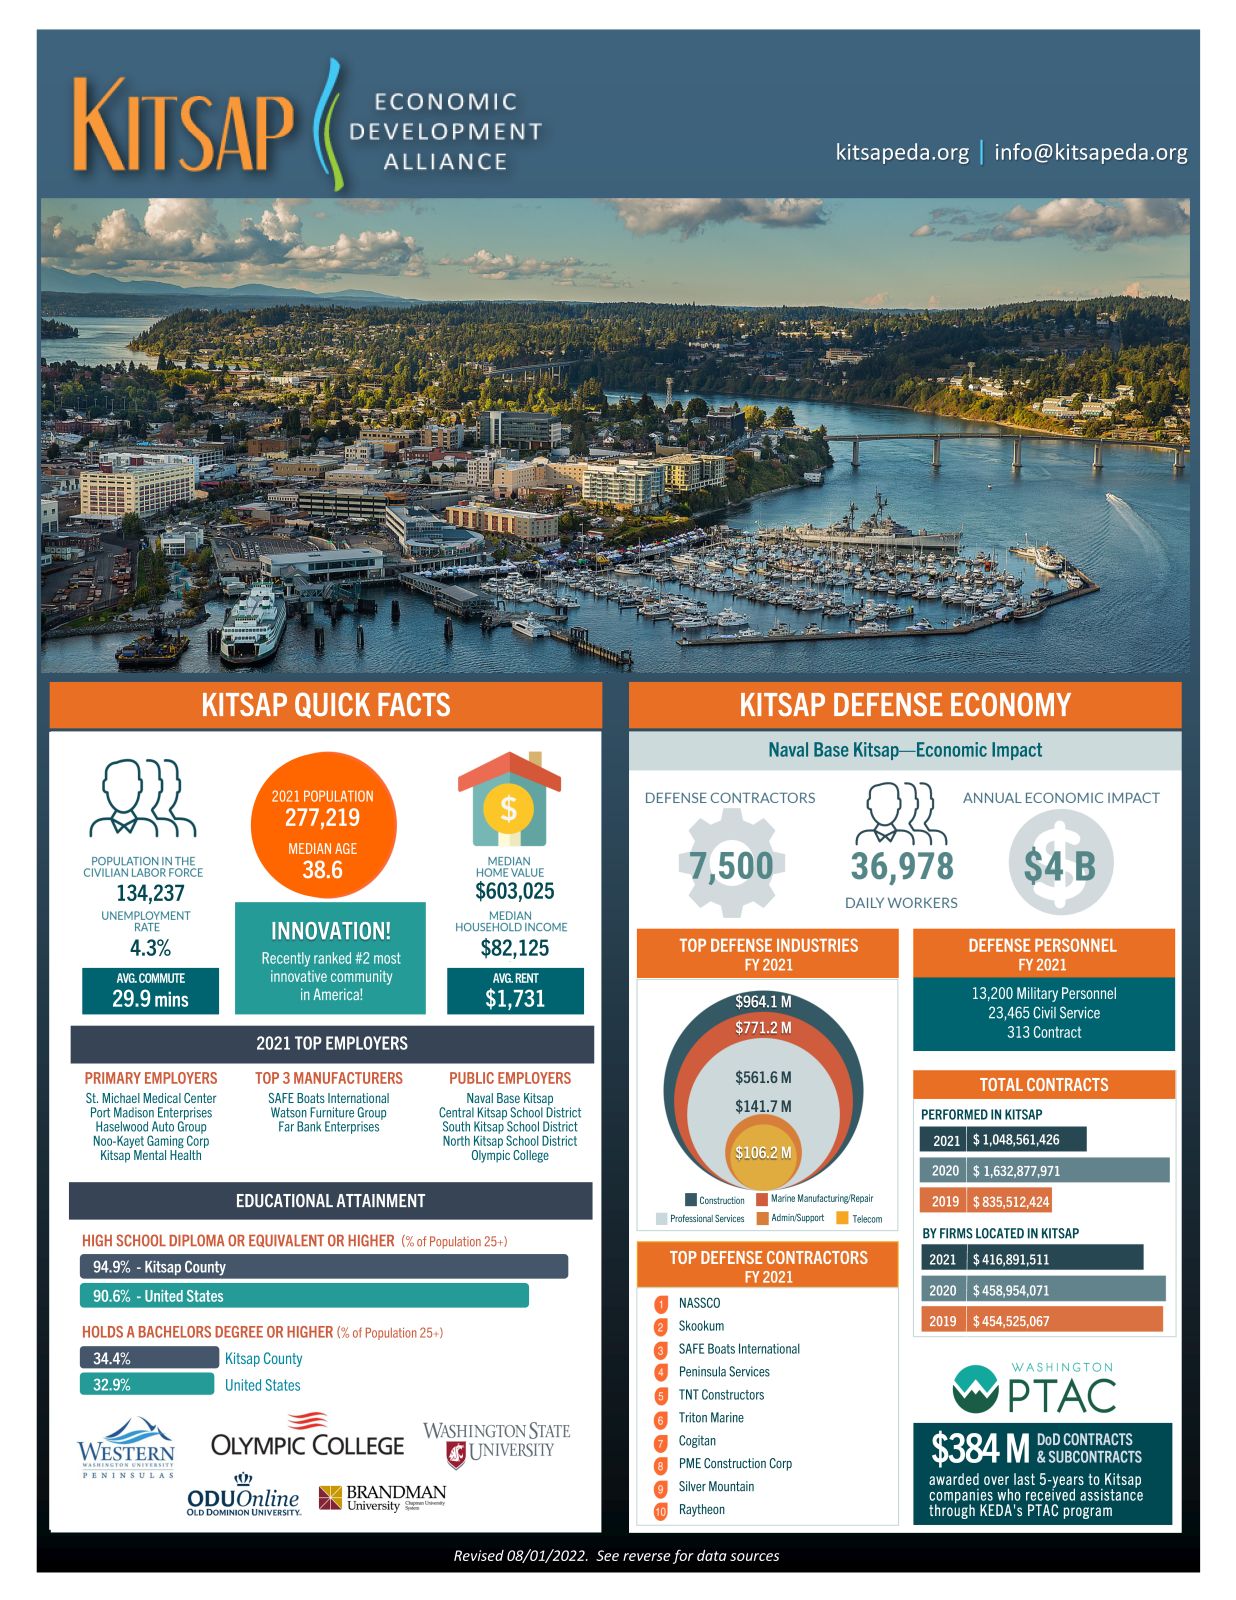
Located in the Central Puget Sound, Kitsap County offers all the benefits of the Seattle/Tacoma Market without the gridlock and high prices. Kitsap residents and visitors enjoy over 250 miles of scenic saltwater coastline, friendly, laid-back communities, award-winning golf courses, ready access to transportation for individuals and commerce, a countywide, high-speed fiber optic backbone, and more. Kitsap recently ranked 2nd only to Santa Clara, CA in America’s Most Innovative Communities report. Kitsap County ranks high in essential economic development indicators: educational attainment and skilled workforce; development of intellectual property; per capita economic output; and, median household incomes. Our businesses thrive and prosper in a highly competitive marketplace.
.png)
Population
Population
| Population | 2000 | 2010 | 2023 | 2028 |
|---|---|---|---|---|
| Kitsap County | 231,969 | 251,133 | 281,592 | 285,460 |
Source: ESRI, 2023-10-17
Population by Age
| Population | 2010 | 2023 | 2028 |
|---|---|---|---|
| 0-4 | 14,831 | 14,450 | 14,736 |
| 5-9 | 15,139 | 15,437 | 15,175 |
| 10-14 | 15,987 | 16,310 | 16,321 |
| 15-19 | 17,259 | 16,581 | 16,548 |
| 20-24 | 18,696 | 18,519 | 17,862 |
| 25-29 | 16,880 | 18,021 | 16,128 |
| 30-34 | 14,394 | 18,174 | 17,253 |
| 35-39 | 14,334 | 18,222 | 18,992 |
| 40-44 | 16,189 | 16,864 | 18,869 |
| 45-49 | 19,029 | 15,450 | 17,205 |
| 50-54 | 19,753 | 17,368 | 15,868 |
| 55-59 | 18,878 | 19,531 | 17,672 |
| 60-64 | 16,468 | 21,058 | 18,933 |
| 65-69 | 11,646 | 19,260 | 19,548 |
| 70-74 | 7,506 | 15,425 | 16,944 |
| 75-79 | 5,375 | 9,996 | 12,884 |
| 80-84 | 4,259 | 5,649 | 8,194 |
| 85+ | 4,510 | 5,277 | 6,328 |
| 18+ | 194,637 | 225,813 | 229,646 |
| Median Age | 39 | 42 | 43 |
Source: ESRI, 2023-10-17
Population by Race
| Kitsap County | 2023 |
|---|---|
| Total | 281,592.00 |
| White Alone | 73.36 |
| Black Alone | 3.01 |
| American Indian Alone | 1.57 |
| Asian Alone | 5.90 |
| Pacific Islander Alone | 1.12 |
| Some Other Race | 3.08 |
| Two or More Races | 11.97 |
| Hispanic Origin | 9.33 |
| Diversity Index | 53.60 |
Source: ESRI, 2023-10-17
Growth Rate
| Kitsap County | 2023 - 2028 |
|---|---|
| Population | 0.27% |
| Households | 0.50% |
| Families | 0.54% |
| Median Household Income | 3% |
| Per Capita Income | 3% |
Source: ESRI, 2023-10-17
Back To TopHousing
Households
| Population | 2000 | 2010 | 2023 | 2028 |
|---|---|---|---|---|
| Households | 86,416 | 97,220 | 108,636 | 111,356 |
| Housing Units | 92,644 | 107,367 | 116,081 | 118,927 |
| Owner Occupied Units | 78,368 | 79,663 | ||
| Renter Occupied Units | 30,268 | 31,693 | ||
| Vacant Units | 7,445 | 7,571 |
Source: ESRI, 2023-10-17
Home Value
| Kitsap County | 2023 | 2028 |
|---|---|---|
| Median Home Value | $496,442 | $678,974 |
| Average Home Value | $596,967 | $791,384 |
| <$50,000 | 998 | 227 |
| $50,000 - $99,999 | 966 | 139 |
| $100,000 - $149,999 | 492 | 27 |
| $150,000 - $199,999 | 935 | 71 |
| $200,000 - $249,999 | 2,339 | 326 |
| $250,000 - $299,999 | 2,018 | 492 |
| $300,000 - $399,999 | 12,010 | 5,371 |
| $400,000 - $499,999 | 20,137 | 14,806 |
| $500,000 - $749,999 | 23,101 | 25,656 |
| $1,000,000 + | 3,981 | 11,169 |
Source: ESRI, 2023-10-17
Housing Year Built
| Year Range | Houses Built |
|---|---|
| 2010 or Later | 8,617 |
| 2000-2009 | 15,422 |
| 1990-1999 | 22,581 |
| 1980-1989 | 18,864 |
| 1970-1979 | 19,679 |
| 1960-1969 | 7,199 |
| 1950-1959 | 5,038 |
| 1940-1949 | 6,337 |
| 1939 or Before | 8,560 |
Source: ESRI, 2023-10-17
Back To TopIncome
Income
| Kitsap County | 2023 | 2028 |
|---|---|---|
| Median Household | $89,395 | $105,254 |
| Average Household | $126,439 | $148,099 |
| Per Capita | $49,124 | $58,112 |
Source: ESRI, 2023-10-17
Household Income Base
| Kitsap County | 2023 |
|---|---|
| <$15,000 | 6,653 |
| $15,000 - $24,999 | 5,951 |
| $25,000 - $34,999 | 4,982 |
| $35,000 - $49,999 | 10,074 |
| $50,000 - $74,999 | 17,006 |
| $75,000 - $99,999 | 15,035 |
| $100,000 - $149,999 | 21,185 |
| $150,000 - $199,999 | 12,366 |
| $200,000+ | 15,380 |
Source: ESRI, 2023-10-17
Back To TopEmployees
Commute
| Category | Commuters |
|---|---|
| Workers 16+ | 129,750 |
| In-County Residents | 108,164 |
| Out-of-County Residents | 20,608 |
| Drive Alone | 85,895 |
| Carpooled | 10,517 |
| Public Transport | 9,590 |
| Work at Home | 13,639 |
| Less than 5 minutes | 2,485 |
| 5-9 minutes | 9,671 |
| 10-14 minutes | 16,908 |
| 15-19 minutes | 19,336 |
| 20-24 minutes | 17,191 |
| 25-29 minutes | 7,424 |
| 30-34 minutes | 14,033 |
| 35-39 minutes | 2,913 |
| 40-44 minutes | 3,709 |
| 45-59 minutes | 7,506 |
| 60-89 minutes | 7,459 |
| 90+ minutes | 7,476 |
| Average Travel Time | 29 |
Source: ESRI, 2023-10-17
Source: ESRI, 2023-10-17
Employees by NAICS
| Category | Number |
|---|---|
| Total Employees | 77,494 |
| Agr/Forestry/Fish/Hunt | 171 |
| Mining | 15 |
| Utilities | 165 |
| Construction | 3,756 |
| Manufacturing | 2,069 |
| Wholesale Trade | 1,085 |
| Retail Trade | 12,477 |
| Motor Veh/Parts Dealers | 1,508 |
| Furn & Home Furnish Str | 378 |
| Electronics & Appl Store | 334 |
| Bldg Matl/Garden Equip | 1,428 |
| Food & Beverage Stores | 2,865 |
| Health/Pers Care Stores | 1,135 |
| Gasoline Stations | 432 |
| Clothing/Accessory Store | 463 |
| Sports/Hobby/Book/Music | 2,124 |
| General Merchandise Str | 1,810 |
| Misc Store Retailers | 0 |
| Nonstore Retailers | 0 |
| Transportation/Warehouse | 1,411 |
| Information | 1,049 |
| Finance & Insurance | 2,699 |
| Cntrl Bank/Crdt Intrmdtn | 1,507 |
| Sec/Cmdty Cntrct/Oth Inv | 616 |
| Insur/Funds/Trusts/Other | 576 |
| Real Estate/Rent/Leasing | 2,932 |
| Prof/Scientific/Tech Srv | 4,767 |
| Legal Services | 806 |
| Mgmt of Comp/Enterprises | 48 |
| Admin/Support/Waste Mgmt | 1,275 |
| Educational Services | 6,639 |
| HealthCare/Social Assist | 14,319 |
| Arts/Entertainment/Rec | 3,015 |
| Accommodation/Food Srvcs | 8,042 |
| Accommodation | 962 |
| Food Srv/Drinking Places | 7,080 |
| Other Srv excl Pub Admin | 5,583 |
| Auto Repair/Maintenance | 917 |
| Public Administration Emp | 5,532 |
Source: ESRI, 2023-10-17
Educational Attainment (25+)
| Kitsap County | 2023 |
|---|---|
| Some High School | 5,559 |
| Graduated High School | 36,096 |
| Associates Degree | 23,948 |
| Bachelor's Degree | 49,811 |
| Graduate Degree | 26,427 |
Source: ESRI, 2023-10-17
Back To TopBusinesses
Businesses by NAICS
| Category | Number |
|---|---|
| Total Businesses | 7,882 |
| Agr/Forestry/Fish/Hunt Bus | 41 |
| Mining Bus | 4 |
| Utilities Bus | 11 |
| Construction Bus | 678 |
| Manufacturing Bus | 229 |
| Wholesale Trade Bus | 150 |
| Retail Trade Bus | 1,025 |
| Motor Veh/Parts Dealers Bus | 123 |
| Furn & Home Furnish Str Bus | 63 |
| Electronics & Appl Store Bus | 34 |
| Bldg Matl/Garden Equip Bus | 89 |
| Food & Beverage Stores Bus | 136 |
| Health/Pers Care Stores Bus | 97 |
| Gasoline Stations Bus | 76 |
| Clothing/Accessory Store Bus | 72 |
| Sports/Hobby/Book/Music Bus | 266 |
| General Merchandise Str Bus | 69 |
| Misc Store Retailers Bus | 0 |
| Nonstore Retailers Bus | 0 |
| Transportation/Warehouse Bus | 131 |
| Information Bus | 142 |
| Finance & Insurance Bus | 338 |
| Cntrl Bank/Crdt Intrmdtn Bus | 140 |
| Sec/Cmdty Cntrct/Oth Inv Bus | 97 |
| Insur/Funds/Trusts/Other Bus | 101 |
| Real Estate/Rent/Leasing Bus | 423 |
| Prof/Scientific/Tech Srv Bus | 790 |
| Legal Services Bus | 169 |
| Mgmt of Comp/Enterprises Bus | 10 |
| Admin/Support/Waste Mgmt Bus | 284 |
| Educational Services Bus | 244 |
| HealthCare/Social Assist Bus | 836 |
| Arts/Entertainment/Rec Bus | 184 |
| Accommodation/Food Srvcs Bus | 632 |
| Accommodation Bus | 51 |
| Food Srv/Drinking Places Bus | 581 |
| Other Srv excl Pub Admin Bus | 1,035 |
| Auto Repair/Maintenance Bus | 178 |
| Public Administration Bus | 215 |
Source: ESRI, 2023-10-17
Back To Top

.png)

.png)


.png)