
Bainbridge Island
 Bainbridge Island
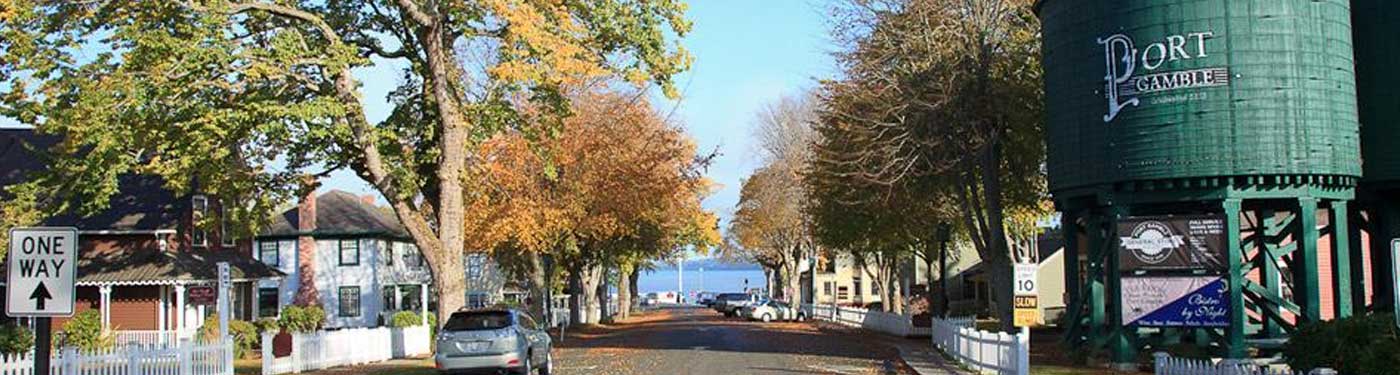
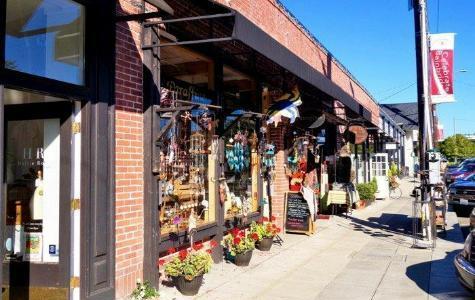
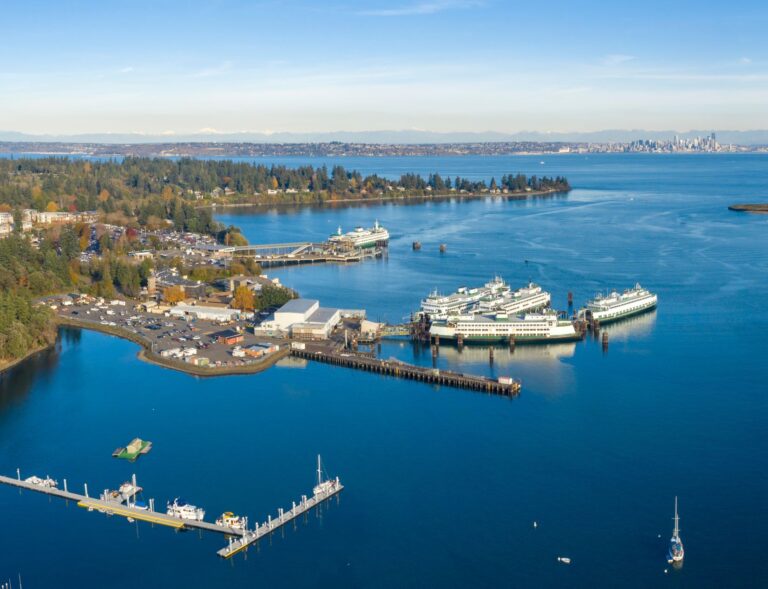
Located 35 minutes by ferry from Seattle, Bainbridge Island residents enjoy easy access to the Seattle’s urban amenities, while enjoying the ease and freedom of life in a rural setting. The island is home to 24,000 residents, over 2000 businesses, a thriving arts community, seven artisan wineries, a brewery and an organic distillery, The Bloedel Reserve public garden, and over 1400 acres of parkland. The vibrant downtown area, just a short walk from the ferry, features boutique shops and restaurants, the newly opened Bainbridge Island Museum of Art, numerous galleries and a waterfront park.
Bainbridge is home to Sage Farbank, makers of world class fly fishing rods and Islandwood, a 255-acre outdoor environmental learning center and conference facility.
Population
Population
| Population | 2000 | 2010 | 2023 | 2028 |
|---|---|---|---|---|
| Bainbridge Island | 20,308 | 23,025 | 25,153 | 25,137 |
Source: ESRI, 2023-10-17
Population by Age
| Population | 2023 |
|---|---|
| 0-4 | 878 |
| 5-9 | 1,395 |
| 10-14 | 1,644 |
| 15-19 | 1,615 |
| 20-24 | 793 |
| 25-29 | 824 |
| 30-34 | 762 |
| 35-39 | 1,128 |
| 40-44 | 1,495 |
| 45-49 | 1,594 |
| 50-54 | 2,083 |
| 55-59 | 2,366 |
| 60-64 | 2,690 |
| 65-69 | 2,202 |
| 70-74 | 1,520 |
| 75-79 | 960 |
| 80-84 | 613 |
| 85+ | 591 |
| 18+ | 20,083 |
| Median Age | 51 |
Source: ESRI, 2023-10-17
Population by Race
| Bainbridge Island | 2023 |
|---|---|
| Total | 25,153.00 |
| White Alone | 84.13% |
| Black Alone | 0.59% |
| American Indian Alone | 0.47% |
| Asian Alone | 3.88% |
| Pacific Islander Alone | 0.15% |
| Some Other Race | 1.28% |
| Two or More Races | 9.5% |
| Hispanic Origin | 4.95% |
| Diversity Index | 34.90 |
Source: ESRI, 2023-10-17
Growth Rate
| Bainbridge Island | 2023 - 2028 |
|---|---|
| Population | -0.01% |
| Households | 0.22% |
| Families | 0.23% |
| Median Household Income | 2% |
| Per Capita Income | 3% |
Source: ESRI, 2023-10-17
Housing
Households
| Population | 2000 | 2010 | 2023 | 2028 |
|---|---|---|---|---|
| Households | 7,979 | 9,470 | 10,371 | 10,483 |
| Housing Units | 8,517 | 10,584 | 11,443 | 11,554 |
| Owner Occupied Units | 8,622 | 8,742 | ||
| Renter Occupied Units | 1,749 | 1,741 | ||
| Vacant Units | 1,072 | 1,071 |
Source: ESRI, 2023-10-17
Home Value
| Bainbridge Island | 2023 | 2028 |
|---|---|---|
| Median Home Value | $866,249 | $1,067,676 |
| Average Home Value | $988,883 | $1,170,956 |
| <$50,000 | 7 | 1 |
| $50,000 - $99,999 | 3 | 1 |
| $100,000 - $149,999 | 1 | 0 |
| $150,000 - $199,999 | 1 | 0 |
| $200,000 - $249,999 | 8 | 1 |
| $250,000 - $299,999 | 8 | 2 |
| $300,000 - $399,999 | 116 | 19 |
| $400,000 - $499,999 | 488 | 158 |
| $500,000 - $749,999 | 2,437 | 1,118 |
| $1,000,000 + | 1,847 | 3,236 |
Source: ESRI, 2023-10-17
Housing Year Built
| Year Range | Houses Built |
|---|---|
| 2010 or Later | 1,066 |
| 2000-2009 | 1,747 |
| 1990-1999 | 1,860 |
| 1980-1989 | 1,852 |
| 1970-1979 | 1,725 |
| 1960-1969 | 611 |
| 1950-1959 | 316 |
| 1940-1949 | 395 |
| 1939 or Before | 783 |
Source: ESRI, 2023-10-17
Back To TopIncome
Income
| Bainbridge Island | 2023 | 2028 |
|---|---|---|
| Median Household | $154,033 | $169,278 |
| Average Household | $210,914 | $237,283 |
| Per Capita | $86,978 | $98,970 |
Source: ESRI, 2023-10-17
Household Income
| Bainbridge Island | 2023 |
|---|---|
| <$15,000 | 405 |
| $15,000 - $24,999 | 334 |
| $25,000 - $34,999 | 292 |
| $35,000 - $49,999 | 556 |
| $50,000 - $74,999 | 832 |
| $75,000 - $99,999 | 871 |
| $100,000 - $149,999 | 1,719 |
| $150,000 - $199,999 | 1,632 |
| $200,000+ | 3,730 |
Source: ESRI, 2023-10-17
Back To TopEmployees
Commute
| Category | Commuters |
|---|---|
| Workers 16+ | 11,079 |
| In-County Residents | 8,020 |
| Out-of-County Residents | 2,920 |
| Drive Alone | 4,263 |
| Carpooled | 383 |
| Public Transport | 2,231 |
| Work at Home | 3,225 |
| Motorcycle | 60 |
| Bicycle | 193 |
| Walked | 598 |
| Other | 100 |
| Less than 5 minutes | 345 |
| 5-9 minutes | 938 |
| 10-14 minutes | 1,225 |
| 15-19 minutes | 870 |
| 20-24 minutes | 391 |
| 25-29 minutes | 135 |
| 30-34 minutes | 440 |
| 35-39 minutes | 47 |
| 40-44 minutes | 195 |
| 45-59 minutes | 737 |
| 60-89 minutes | 1,381 |
| 90+ minutes | 1,150 |
| Average Travel Time | 0 |
Source: ESRI, 2023-10-17
Source: ESRI, 2023-10-17
Employees by NAICS
| Category | Number |
|---|---|
| Total Employees | 8,477 |
| Agr/Forestry/Fish/Hunt | 30 |
| Mining | 0 |
| Utilities | 35 |
| Construction | 450 |
| Manufacturing | 223 |
| Wholesale Trade | 70 |
| Retail Trade | 1,367 |
| Motor Veh/Parts Dealers | 51 |
| Furn & Home Furnish Str | 39 |
| Electronics & Appl Store | 87 |
| Bldg Matl/Garden Equip | 74 |
| Food & Beverage Stores | 414 |
| Health/Pers Care Stores | 84 |
| Gasoline Stations | 7 |
| Clothing/Accessory Store | 37 |
| Sports/Hobby/Book/Music | 549 |
| General Merchandise Str | 25 |
| Transportation/Warehouse | 123 |
| Information | 289 |
| Finance & Insurance | 310 |
| Cntrl Bank/Crdt Intrmdtn | 171 |
| Sec/Cmdty Cntrct/Oth Inv | 83 |
| Insur/Funds/Trusts/Other | 56 |
| Real Estate/Rent/Leasing | 747 |
| Prof/Scientific/Tech Srv | 867 |
| Legal Services | 147 |
| Mgmt of Comp/Enterprises | 14 |
| Admin/Support/Waste Mgmt | 205 |
| Educational Services | 688 |
| HealthCare/Social Assist | 707 |
| Arts/Entertainment/Rec | 455 |
| Accommodation/Food Srvcs | 549 |
| Accommodation | 55 |
| Food Srv/Drinking Places | 494 |
| Other Srv excl Pub Admin | 684 |
| Auto Repair/Maintenance | 83 |
| Public Administration Emp | 562 |
Source: ESRI, 2023-10-17
Educational Attainment (25+)
| Bainbridge Island | 2023 |
|---|---|
| <9th Grade | 54 |
| Some High School | 61 |
| GED | 198 |
| Graduated High School | 951 |
| Some College/No Degree | 2,118 |
| Associates Degree | 1,006 |
| Bachelor's Degree | 7,724 |
| Graduate Degree | 6,716 |
Source: ESRI, 2023-10-17
Back To TopBusinesses
Businesses by NAICS
| Category | Number |
|---|---|
| Total Businesses | 1,301 |
| Agr/Forestry/Fish/Hunt Bus | 7 |
| Mining Bus | 1 |
| Utilities Bus | 4 |
| Construction Bus | 87 |
| Manufacturing Bus | 40 |
| Wholesale Trade Bus | 17 |
| Retail Trade Bus | 151 |
| Motor Veh/Parts Dealers Bus | 13 |
| Furn & Home Furnish Str Bus | 12 |
| Electronics & Appl Store Bus | 5 |
| Bldg Matl/Garden Equip Bus | 11 |
| Food & Beverage Stores Bus | 22 |
| Health/Pers Care Stores Bus | 9 |
| Gasoline Stations Bus | 2 |
| Clothing/Accessory Store Bus | 11 |
| Sports/Hobby/Book/Music Bus | 59 |
| General Merchandise Str Bus | 7 |
| Transportation/Warehouse Bus | 17 |
| Information Bus | 29 |
| Finance & Insurance Bus | 55 |
| Cntrl Bank/Crdt Intrmdtn Bus | 19 |
| Sec/Cmdty Cntrct/Oth Inv Bus | 22 |
| Insur/Funds/Trusts/Other Bus | 14 |
| Real Estate/Rent/Leasing Bus | 68 |
| Prof/Scientific/Tech Srv Bus | 222 |
| Legal Services Bus | 44 |
| Mgmt of Comp/Enterprises Bus | 4 |
| Admin/Support/Waste Mgmt Bus | 39 |
| Educational Services Bus | 44 |
| HealthCare/Social Assist Bus | 102 |
| Arts/Entertainment/Rec Bus | 46 |
| Accommodation/Food Srvcs Bus | 68 |
| Accommodation Bus | 12 |
| Food Srv/Drinking Places Bus | 56 |
| Other Srv excl Pub Admin Bus | 139 |
| Auto Repair/Maintenance Bus | 14 |
| Public Administration Bus | 29 |
Source: ESRI, 2023-10-17
Back To Top


.png)

.png)


.png)