Silverdale
Silverdale
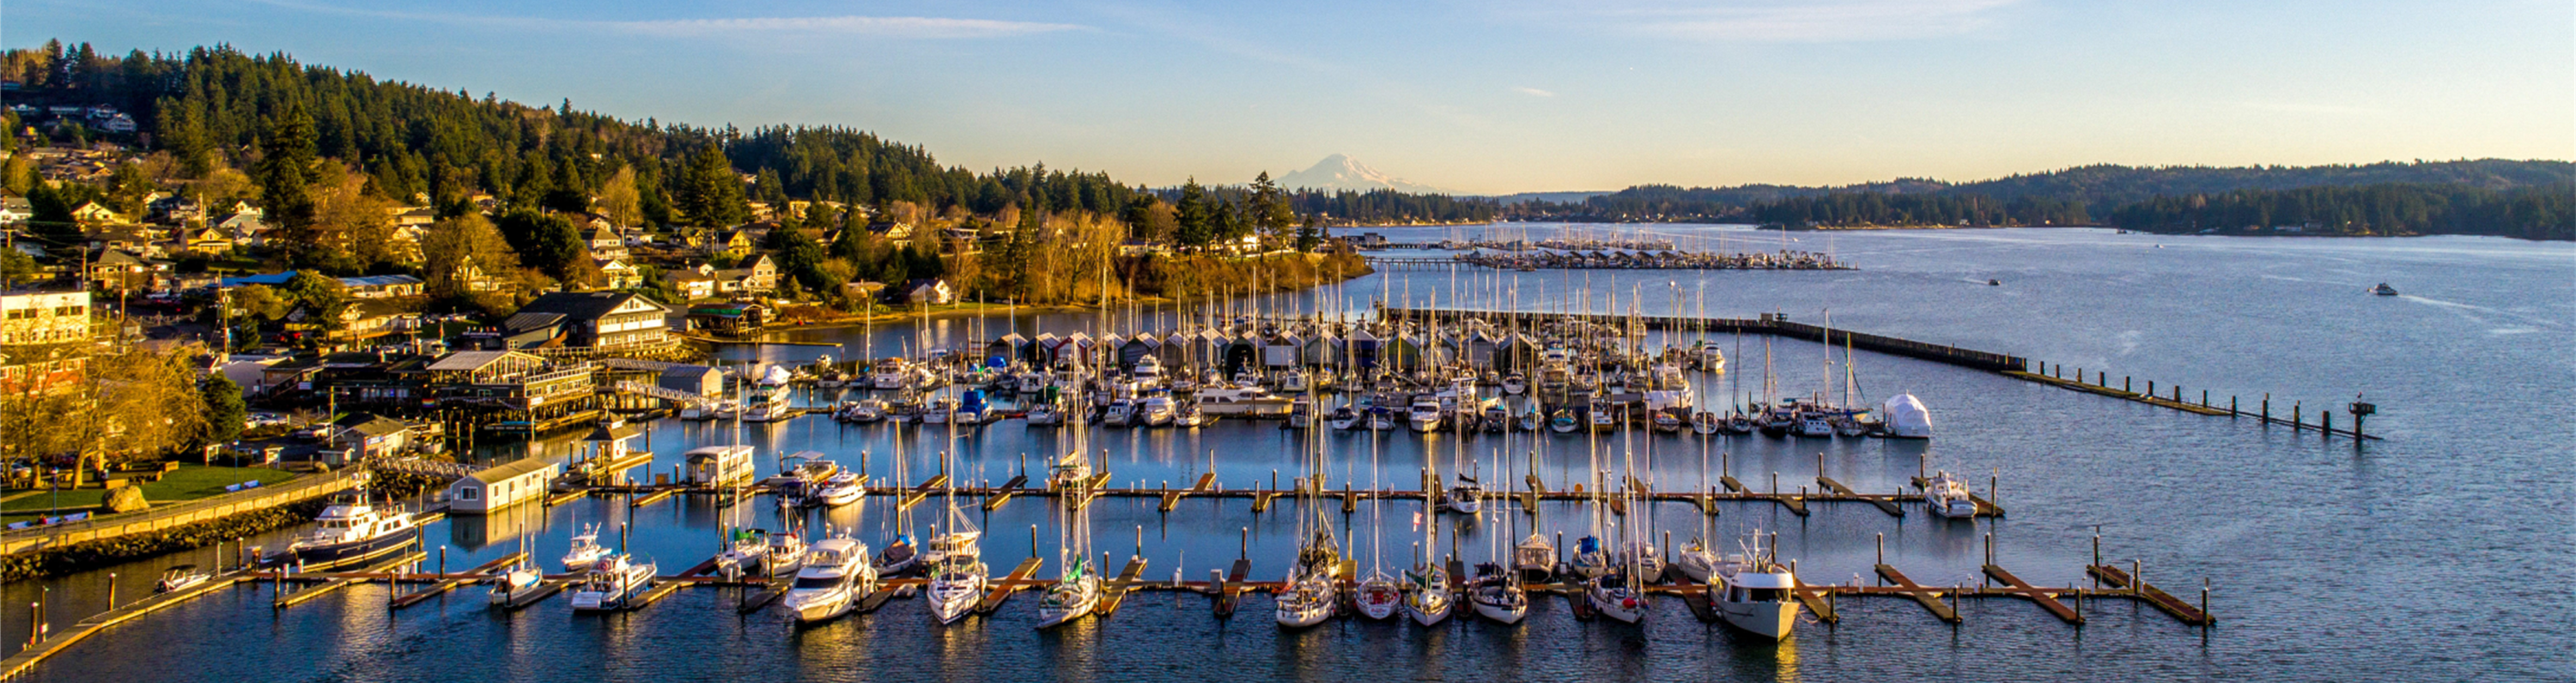
Silverdale is situated in the geographic center of Kitsap County just north of Bremerton and South of Poulsbo. With 20,000 residents, it is Kitsap’s second largest community, a retail and services hub for both the Kitsap and Olympic Peninsulas. Over the last few decades Silverdale has seen ongoing continued private investment, most recently in the $500 million dollar world-class St. Michel Medical Center opened in 2020 by Virginia Mason Franciscan Health. The area also sees significant investment and support for civic initiatives, such as the $23 million YMCA opened in 2011 and the new $10 million Kitsap Regional Library opening in 2021.
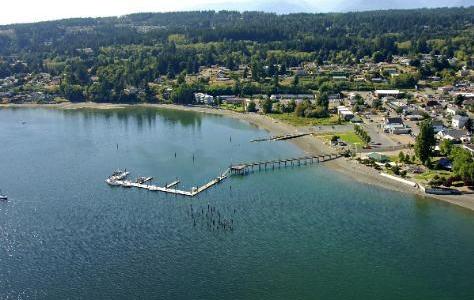
 Silverdale is best known for its retail options, anchored by the 300,000 square-foot legacy Kitsap Mall and the newer facility The Trails, a 212,000 square-foot modern outdoor shopping park opened in 2015. It is an unincorporated community that relies upon Kitsap County for governance. Silverdale is a waterfront community with maritime heritage, a redeveloping old town, and the urban Clear Creek Trail that winds its way through the community: From the water, next to a salmon stream, across the city.
Population
Population
| Population | 2000 | 2010 | 2024 | 2029 |
|---|---|---|---|---|
| Silverdale | 19,722 | 19,204 | 21,833 | 22,288 |
Source: ESRI, 2024-09-18
Population by Age
| Population | 2024 |
|---|---|
| 0-4 | 1,139 |
| 5-9 | 1,209 |
| 10-14 | 1,145 |
| 15-19 | 1,141 |
| 20-24 | 1,305 |
| 25-29 | 2,137 |
| 30-34 | 1,889 |
| 35-39 | 1,575 |
| 40-44 | 1,462 |
| 45-49 | 1,217 |
| 50-54 | 1,117 |
| 55-59 | 1,083 |
| 60-64 | 1,272 |
| 65-69 | 1,250 |
| 70-74 | 1,080 |
| 75-79 | 827 |
| 80-84 | 495 |
| 85+ | 490 |
| 18+ | 17,647 |
| Median Age | 38 |
Source: ESRI, 2024-09-18
Population by Race
| Silverdale | 2024 |
|---|---|
| Total | 21,833.00 |
| White Alone | 65.41% |
| Black Alone | 3.48% |
| American Indian Alone | 0.98% |
| Asian Alone | 11.47% |
| Pacific Islander Alone | 1.22% |
| Some Other Race | 3.63% |
| Two or More Races | 13.81% |
| Hispanic Origin | 11.10% |
| Diversity Index | 62.80 |
Source: ESRI, 2024-09-18
Growth Rate
| Silverdale | 2024 - 2029 |
|---|---|
| Population | 0.41% |
| Households | 0.52% |
| Families | 0.57% |
| Median Household Income | 2% |
| Per Capita Income | 3% |
Source: ESRI, 2024-09-18
Housing
Households
| Population | 2000 | 2010 | 2024 | 2029 |
|---|---|---|---|---|
| Households | 7,213 | 7,828 | 8,786 | 9,016 |
| Housing Units | 7,639 | 8,555 | 9,289 | 9,510 |
| Owner Occupied Units | 5,092 | 5,372 | ||
| Renter Occupied Units | 3,694 | 3,644 | ||
| Vacant Units | 503 | 494 |
Source: ESRI, 2024-09-18
Home Value
| Silverdale | 2024 | 2029 |
|---|---|---|
| Median Home Value | $605,686 | $712,500 |
| Average Home Value | $677,824 | $876,285 |
| <$50,000 | 121 | 29 |
| $50,000 - $99,999 | 32 | 3 |
| $100,000 - $149,999 | 3 | 0 |
| $150,000 - $199,999 | 8 | 0 |
| $200,000 - $249,999 | 13 | 1 |
| $250,000 - $299,999 | 42 | 5 |
| $300,000 - $399,999 | 275 | 37 |
| $400,000 - $499,999 | 1,020 | 477 |
| $500,000 - $749,999 | 2,440 | 2,510 |
| $1,000,000 + | 245 | 591 |
Source: ESRI, 2024-09-18
Housing Year Built
| Year Range | Houses Built |
|---|---|
| 2010 or Later | 623 |
| 2000-2009 | 930 |
| 1990-1999 | 3,111 |
| 1980-1989 | 2,242 |
| 1970-1979 | 935 |
| 1960-1969 | 532 |
| 1950-1959 | 151 |
| 1940-1949 | 116 |
| 1939 or Before | 234 |
Source: ESRI, 2024-09-18
Back To TopIncome
Income
| Silverdale | 2024 | 2029 |
|---|---|---|
| Median Household | $102,090 | $112,287 |
| Average Household | $125,979 | $146,894 |
| Per Capita | $50,714 | $59,440 |
Source: ESRI, 2024-09-18
Household Income
| Silverdale | 2024 |
|---|---|
| <$15,000 | 475 |
| $15,000 - $24,999 | 306 |
| $25,000 - $34,999 | 328 |
| $35,000 - $49,999 | 600 |
| $50,000 - $74,999 | 1,270 |
| $75,000 - $99,999 | 1,263 |
| $100,000 - $149,999 | 2,201 |
| $150,000 - $199,999 | 1,179 |
| $200,000+ | 1,164 |
Source: ESRI, 2024-09-18
Back To TopEmployees
Commute
| Category | Commuters |
|---|---|
| Workers 16+ | 10,644 |
| In-County Residents | 9,634 |
| Out-of-County Residents | 885 |
| Drive Alone | 8,108 |
| Carpooled | 984 |
| Public Transport | 480 |
| Work at Home | 788 |
| Motorcycle | 63 |
| Bicycle | 4 |
| Walked | 111 |
| Other | 106 |
| Less than 5 minutes | 247 |
| 5-9 minutes | 788 |
| 10-14 minutes | 1,287 |
| 15-19 minutes | 2,006 |
| 20-24 minutes | 1,791 |
| 25-29 minutes | 444 |
| 30-34 minutes | 1,372 |
| 35-39 minutes | 105 |
| 40-44 minutes | 208 |
| 45-59 minutes | 569 |
| 60-89 minutes | 542 |
| 90+ minutes | 497 |
| Average Travel Time | 27 |
Source: ESRI, 2024-09-18
Source: ESRI, 2024-09-18
Employees by NAICS
| Category | Number |
|---|---|
| Total Employees | 13,881 |
| Agr/Forestry/Fish/Hunt | 13 |
| Mining | 1 |
| Utilities | 25 |
| Construction | 444 |
| Manufacturing | 149 |
| Wholesale Trade | 75 |
| Retail Trade | 3,677 |
| Motor Veh/Parts Dealers | 117 |
| Furn & Home Furnish Str | 136 |
| Electronics & Appl Store | 195 |
| Bldg Matl/Garden Equip | 396 |
| Food & Beverage Stores | 381 |
| Health/Pers Care Stores | 287 |
| Gasoline Stations | 70 |
| Clothing/Accessory Store | 316 |
| Sports/Hobby/Book/Music | 677 |
| General Merchandise Str | 1,102 |
| Transportation/Warehouse | 97 |
| Information | 139 |
| Finance & Insurance | 473 |
| Cntrl Bank/Crdt Intrmdtn | 216 |
| Sec/Cmdty Cntrct/Oth Inv | 122 |
| Insur/Funds/Trusts/Other | 135 |
| Real Estate/Rent/Leasing | 565 |
| Prof/Scientific/Tech Srv | 680 |
| Legal Services | 294 |
| Mgmt of Comp/Enterprises | 2 |
| Admin/Support/Waste Mgmt | 138 |
| Educational Services | 710 |
| HealthCare/Social Assist | 3,355 |
| Arts/Entertainment/Rec | 240 |
| Accommodation/Food Srvcs | 2,037 |
| Accommodation | 174 |
| Food Srv/Drinking Places | 1,863 |
| Other Srv excl Pub Admin | 706 |
| Auto Repair/Maintenance | 86 |
| Public Administration Emp | 315 |
Source: ESRI, 2024-09-18
Educational Attainment (25+)
| Silverdale | 2024 |
|---|---|
| <9th Grade | 266 |
| Some High School | 350 |
| GED | 446 |
| Graduated High School | 2,910 |
| Some College/No Degree | 3,776 |
| Associates Degree | 2,125 |
| Bachelor's Degree | 3,786 |
| Graduate Degree | 2,235 |
Source: ESRI, 2024-09-18
Back To TopBusinesses
Businesses by NAICS
| Category | Number |
|---|---|
| Total Businesses | 1,236 |
| Agr/Forestry/Fish/Hunt Bus | 3 |
| Mining Bus | 1 |
| Utilities Bus | 1 |
| Construction Bus | 51 |
| Manufacturing Bus | 22 |
| Wholesale Trade Bus | 15 |
| Retail Trade Bus | 191 |
| Motor Veh/Parts Dealers Bus | 8 |
| Furn & Home Furnish Str Bus | 14 |
| Electronics & Appl Store Bus | 12 |
| Bldg Matl/Garden Equip Bus | 12 |
| Food & Beverage Stores Bus | 15 |
| Health/Pers Care Stores Bus | 29 |
| Gasoline Stations Bus | 13 |
| Clothing/Accessory Store Bus | 32 |
| Sports/Hobby/Book/Music Bus | 40 |
| General Merchandise Str Bus | 16 |
| Transportation/Warehouse Bus | 9 |
| Information Bus | 18 |
| Finance & Insurance Bus | 85 |
| Cntrl Bank/Crdt Intrmdtn Bus | 30 |
| Sec/Cmdty Cntrct/Oth Inv Bus | 31 |
| Insur/Funds/Trusts/Other Bus | 24 |
| Real Estate/Rent/Leasing Bus | 79 |
| Prof/Scientific/Tech Srv Bus | 95 |
| Legal Services Bus | 30 |
| Mgmt of Comp/Enterprises Bus | 1 |
| Admin/Support/Waste Mgmt Bus | 31 |
| Educational Services Bus | 30 |
| HealthCare/Social Assist Bus | 286 |
| Arts/Entertainment/Rec Bus | 14 |
| Accommodation/Food Srvcs Bus | 113 |
| Accommodation Bus | 7 |
| Food Srv/Drinking Places Bus | 106 |
| Other Srv excl Pub Admin Bus | 138 |
| Auto Repair/Maintenance Bus | 17 |
| Public Administration Bus | 20 |
Source: ESRI, 2024-09-18
Back To Top

.png)

.png)

.png)