Housing and Income
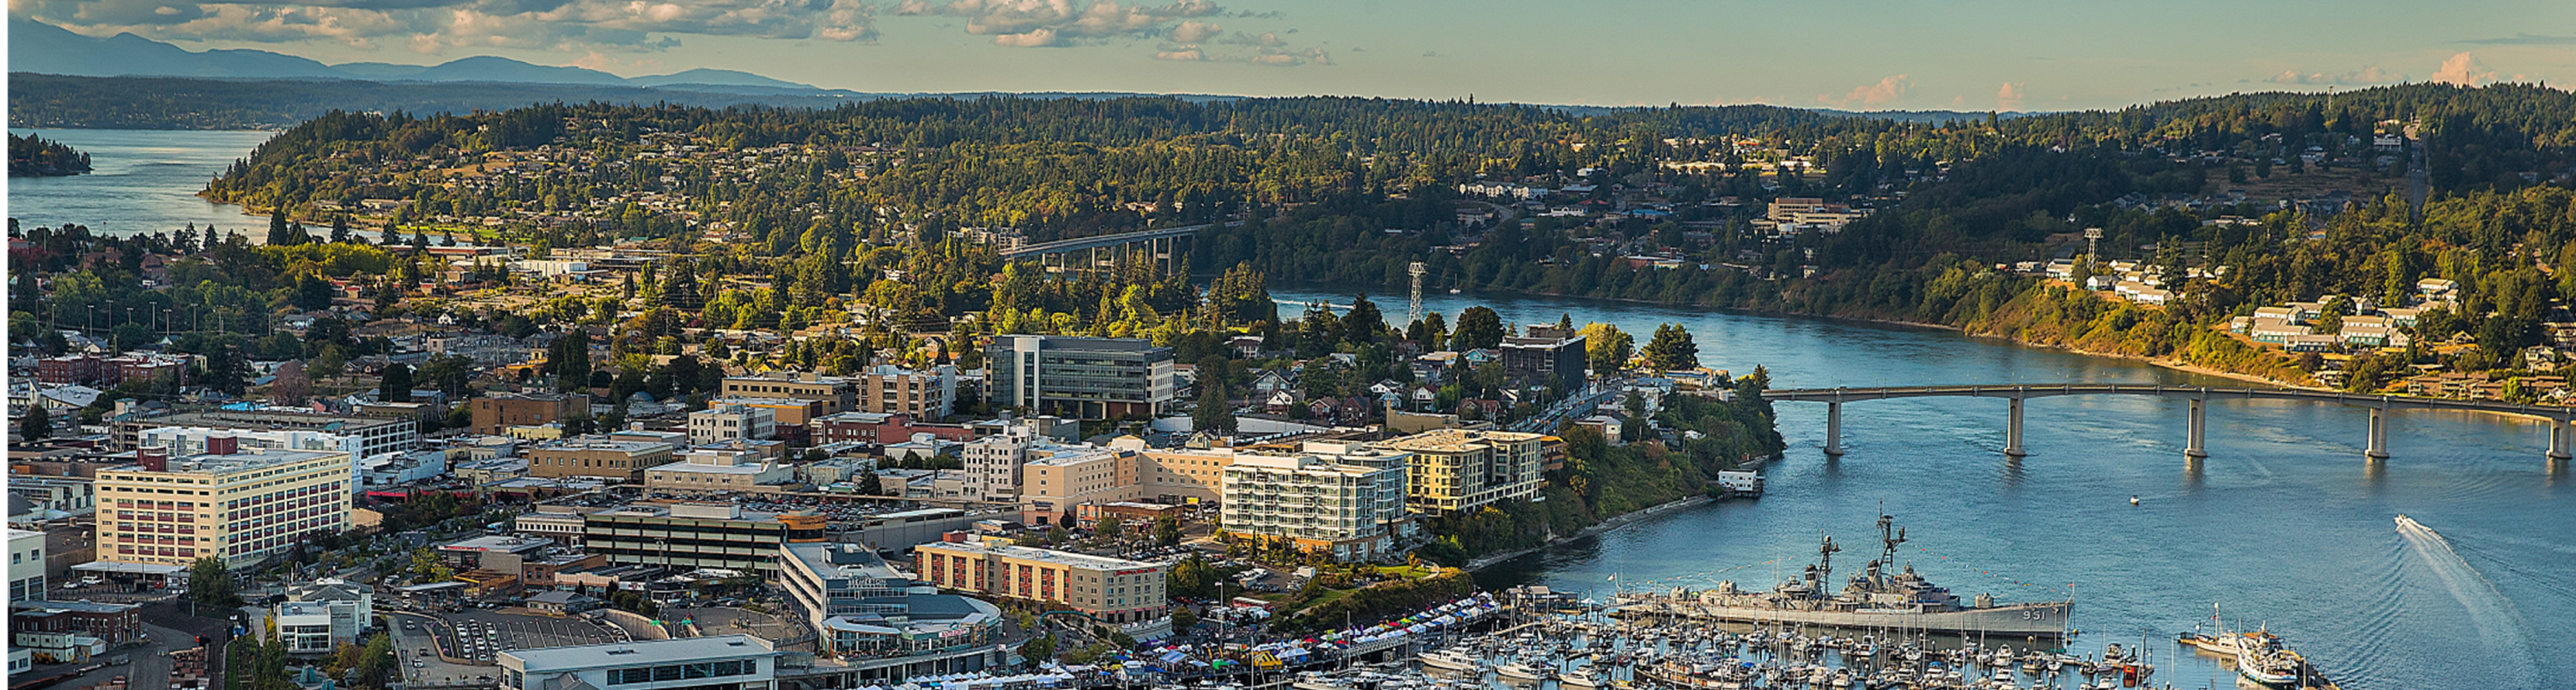
Nature, water, forest, mountains—and a community within easy, affordable reach of Seattle.
Like the rest of Puget Sound, Kitsap has recently seen strong residential growth as the pandemic reshapes where people live. While prices are rising her as they are elsewhere, in comparison Kitsap remains affordable: The Washington Center for Real Estate Research's Housing Affordability Index typically shows Kitsap as more affordable than Washington state as a whole. As people move to this spectacular community, we’re making room: As of September 2021, 9,000 homes were under construction or permit for Kitsap.
Since 2019, we’ve seen significant and typical appreciation of home values in Kitsap—which price-wise still remain approximately 11%[1] lower than comparable properties in the region. Median rent for a two-bedroom home in the Bremerton-Silverdale metro as of summer 2021 was estimated at $1,587. This is comparable to Pierce County / Tacoma ($1,572), and significantly lower than King and Snohomish counties with respect to the Seattle-Bellevue Metro area ($1,906).
Housing expense in Kitsap typically follows a geographical pattern: Highest cost is found in the north of the county, in the municipalities of Bainbridge Island, Poulsbo, and in the rural center-west of the county, where views of the Olympic Mountains are plentiful. Lower costs are found in the peninsula’s south, in Bremerton and Port Orchard. It’s worth noting that this is a general rule, however, and that exceptions abound.
[1] Per the Northwest MLS, as measured in August 2019, 2020, 2021

.png)

.png)

.png)