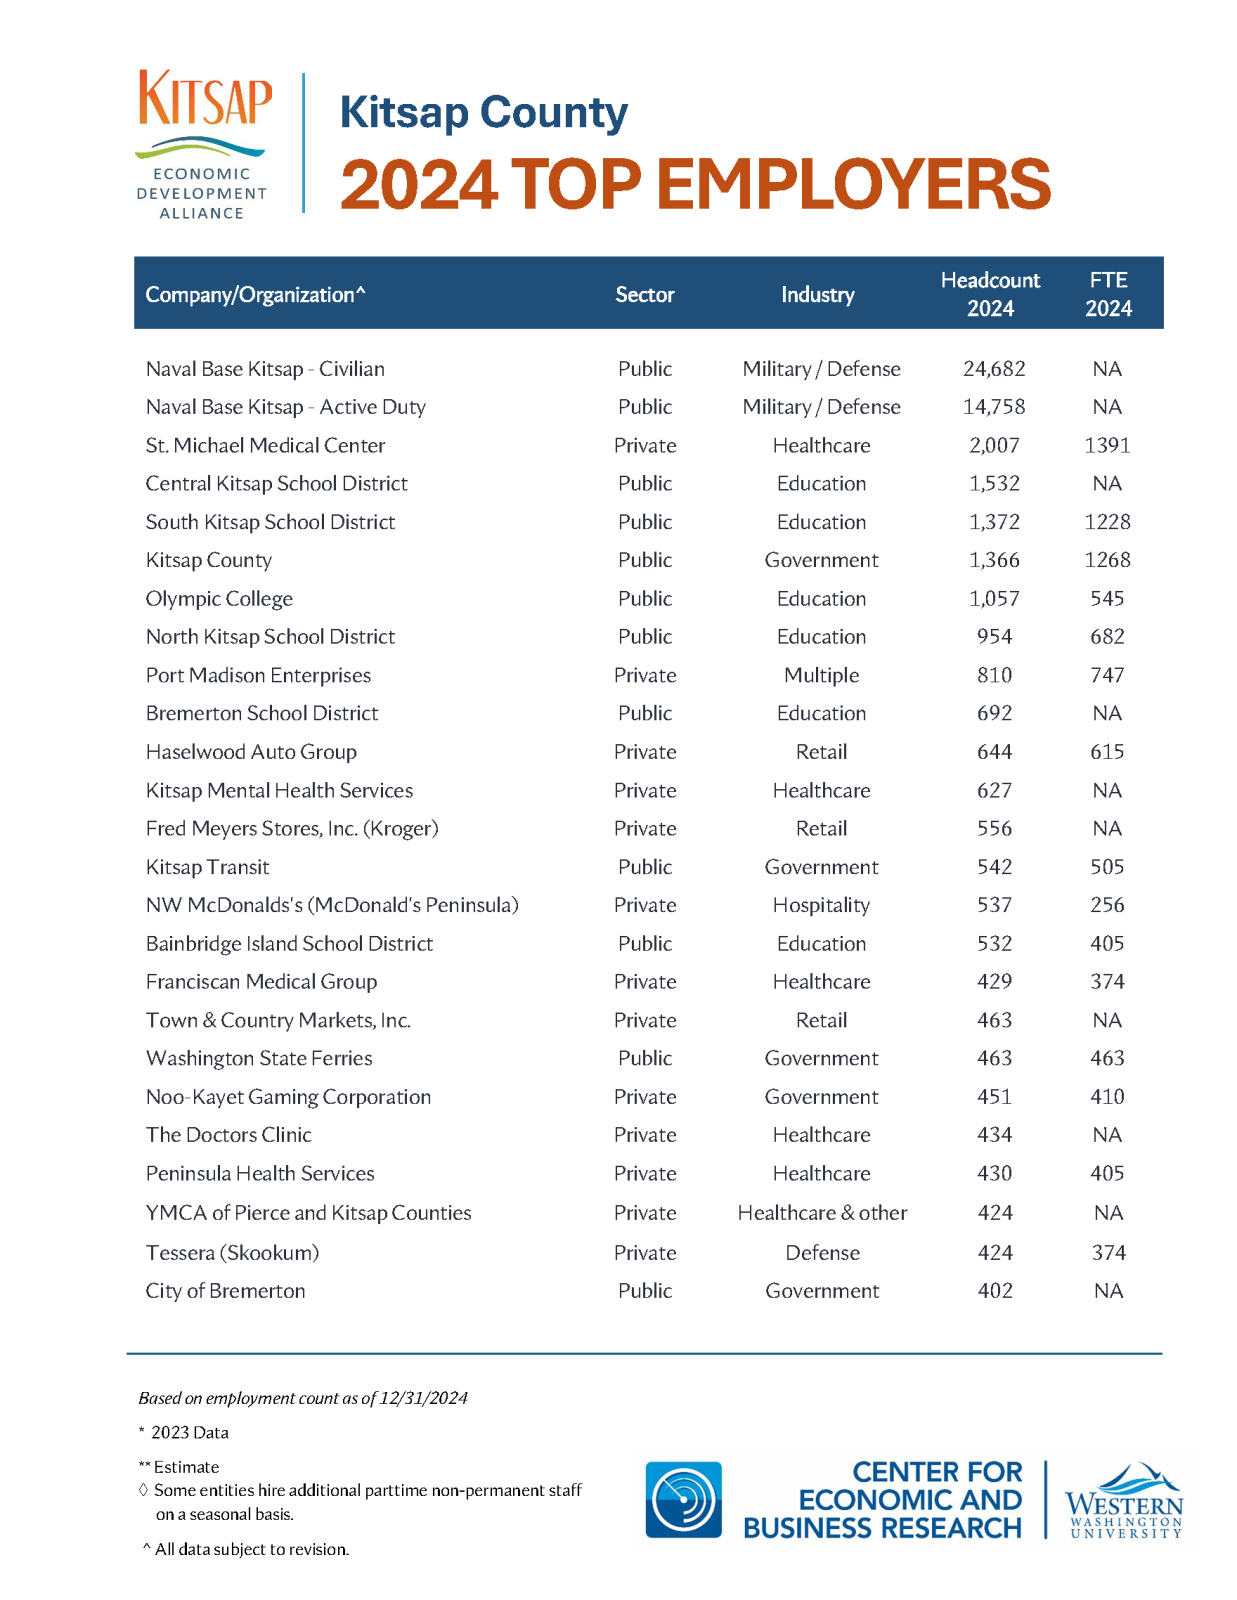
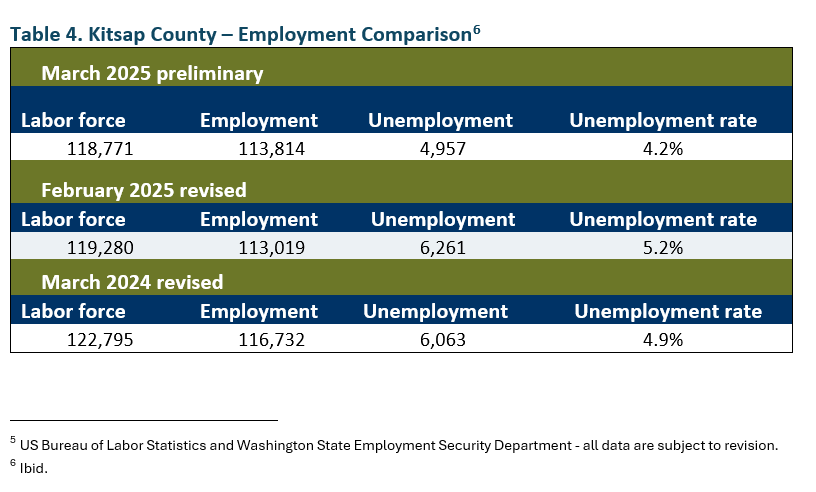
Kitsap County
Located in the Central Puget Sound, Kitsap County offers all the benefits of the Seattle/Tacoma Market without the gridlock and high prices. Kitsap residents and visitors enjoy over 250 miles of scenic saltwater coastline, friendly, laid-back communities, award-winning golf courses, ready access to transportation for individuals and commerce, a countywide, high-speed fiber optic backbone, and more.
.png)
Population
Back To Top
Back To Top
Population
| Population | 2000 | 2010 | 2024 | 2029 |
|---|---|---|---|---|
| Kitsap County | 231,974 | 251,135 | 283,073 | 288,870 |
Source: ESRI, 2024-09-18
Population by Age
| Population | 2024 |
|---|---|
| 0-4 | 14,829 |
| 5-9 | 16,070 |
| 10-14 | 15,812 |
| 15-19 | 15,601 |
| 20-24 | 18,411 |
| 25-29 | 18,743 |
| 30-34 | 20,723 |
| 35-39 | 19,602 |
| 40-44 | 18,616 |
| 45-49 | 15,646 |
| 50-54 | 15,914 |
| 55-59 | 16,478 |
| 60-64 | 18,561 |
| 65-69 | 18,248 |
| 70-74 | 15,827 |
| 75-79 | 11,981 |
| 80-84 | 6,661 |
| 85+ | 5,350 |
| 18+ | 227,208 |
| Median Age | 41 |
Source: ESRI, 2024-09-18
Population by Race
| Kitsap County | 2024 |
|---|---|
| Total | 283,073.00 |
| White Alone | 73.41% |
| Black Alone | 2.94% |
| American Indian Alone | 1.6% |
| Asian Alone | 5.69% |
| Pacific Islander Alone | 1.1% |
| Some Other Race | 3.14% |
| Two or More Races | 12.12% |
| Hispanic Origin | 9.64% |
| Diversity Index | 53.80 |
Source: ESRI, 2024-09-18
Growth Rate
| Kitsap County | 2024 - 2029 |
|---|---|
| Population | 0.41% |
| Households | 0.55% |
| Families | 0.45% |
| Median Household Income | 2% |
| Per Capita Income | 3% |
Source: ESRI, 2024-09-18
Housing
Back To Top
Households
| Population | 2000 | 2010 | 2024 | 2029 |
|---|---|---|---|---|
| Households | 86,417 | 97,221 | 109,342 | 112,366 |
| Housing Units | 92,645 | 107,368 | 117,442 | 120,754 |
| Owner Occupied Units | 78,468 | 80,398 | ||
| Renter Occupied Units | 30,874 | 31,968 | ||
| Vacant Units | 8,100 | 8,388 |
Source: ESRI, 2024-09-18
Home Value
| Kitsap County | 2024 | 2029 |
|---|---|---|
| Median Home Value | $617,771 | $719,346 |
| Average Home Value | $702,362 | $879,043 |
| <$50,000 | 1,413 | 586 |
| $50,000 - $99,999 | 1,243 | 391 |
| $100,000 - $149,999 | 403 | 54 |
| $150,000 - $199,999 | 480 | 45 |
| $200,000 - $249,999 | 558 | 63 |
| $250,000 - $299,999 | 1,188 | 221 |
| $300,000 - $399,999 | 4,725 | 1,654 |
| $400,000 - $499,999 | 13,769 | 8,777 |
| $500,000 - $749,999 | 32,785 | 32,365 |
| $1,000,000 + | 6,203 | 11,436 |
Source: ESRI, 2024-09-18
Housing Year Built
| Year Range | Houses Built |
|---|---|
| 2010 or Later | 9,829 |
| 2000-2009 | 15,751 |
| 1990-1999 | 22,309 |
| 1980-1989 | 18,762 |
| 1970-1979 | 19,219 |
| 1960-1969 | 7,418 |
| 1950-1959 | 4,728 |
| 1940-1949 | 6,527 |
| 1939 or Before | 8,655 |
Source: ESRI, 2024-09-18
Back To TopIncome
Back To Top
Income
| Kitsap County | 2024 | 2029 |
|---|---|---|
| Median Household | $99,445 | $110,816 |
| Average Household | $131,586 | $154,021 |
| Per Capita | $51,163 | $60,240 |
Source: ESRI, 2024-09-18
Household Income
| Kitsap County | 2024 |
|---|---|
| <$15,000 | 7,861 |
| $15,000 - $24,999 | 3,635 |
| $25,000 - $34,999 | 3,411 |
| $35,000 - $49,999 | 8,039 |
| $50,000 - $74,999 | 15,672 |
| $75,000 - $99,999 | 16,328 |
| $100,000 - $149,999 | 25,301 |
| $150,000 - $199,999 | 12,266 |
| $200,000+ | 16,825 |
Source: ESRI, 2024-09-18
Back To TopEmployees
Back To Top
Commute
| Category | Commuters |
|---|---|
| Workers 16+ | 131,017 |
| In-County Residents | 109,479 |
| Out-of-County Residents | 20,829 |
| Drive Alone | 86,609 |
| Carpooled | 11,023 |
| Public Transport | 8,385 |
| Work at Home | 15,146 |
| Motorcycle | 737 |
| Bicycle | 682 |
| Walked | 6,983 |
| Other | 1,320 |
| Less than 5 minutes | 2,629 |
| 5-9 minutes | 10,597 |
| 10-14 minutes | 16,260 |
| 15-19 minutes | 18,882 |
| 20-24 minutes | 16,989 |
| 25-29 minutes | 7,824 |
| 30-34 minutes | 13,639 |
| 35-39 minutes | 2,874 |
| 40-44 minutes | 3,686 |
| 45-59 minutes | 7,361 |
| 60-89 minutes | 7,637 |
| 90+ minutes | 7,493 |
| Average Travel Time | 29 |
Source: ESRI, 2024-09-18
Source: ESRI, 2024-09-18
Employees by NAICS
| Category | Number |
|---|---|
| Total Employees | 80,538 |
| Agr/Forestry/Fish/Hunt | 190 |
| Mining | 6 |
| Utilities | 213 |
| Construction | 4,057 |
| Manufacturing | 2,383 |
| Wholesale Trade | 1,269 |
| Retail Trade | 12,463 |
| Motor Veh/Parts Dealers | 1,534 |
| Furn & Home Furnish Str | 341 |
| Electronics & Appl Store | 323 |
| Bldg Matl/Garden Equip | 1,448 |
| Food & Beverage Stores | 2,884 |
| Health/Pers Care Stores | 1,170 |
| Gasoline Stations | 445 |
| Clothing/Accessory Store | 446 |
| Sports/Hobby/Book/Music | 2,070 |
| General Merchandise Str | 1,802 |
| Transportation/Warehouse | 1,646 |
| Information | 1,301 |
| Finance & Insurance | 2,721 |
| Cntrl Bank/Crdt Intrmdtn | 1,481 |
| Sec/Cmdty Cntrct/Oth Inv | 651 |
| Insur/Funds/Trusts/Other | 589 |
| Real Estate/Rent/Leasing | 2,701 |
| Prof/Scientific/Tech Srv | 5,360 |
| Legal Services | 818 |
| Mgmt of Comp/Enterprises | 76 |
| Admin/Support/Waste Mgmt | 1,543 |
| Educational Services | 6,794 |
| HealthCare/Social Assist | 13,982 |
| Arts/Entertainment/Rec | 2,888 |
| Accommodation/Food Srvcs | 8,346 |
| Accommodation | 724 |
| Food Srv/Drinking Places | 7,622 |
| Other Srv excl Pub Admin | 5,876 |
| Auto Repair/Maintenance | 872 |
| Public Administration Emp | 6,328 |
Source: ESRI, 2024-09-18
Educational Attainment (25+)
| Kitsap County | 2024 |
|---|---|
| <9th Grade | 2,671 |
| Some High School | 6,109 |
| GED | 7,336 |
| Graduated High School | 36,783 |
| Some College/No Degree | 47,382 |
| Associates Degree | 25,165 |
| Bachelor's Degree | 49,618 |
| Graduate Degree | 27,286 |
Source: ESRI, 2024-09-18
Back To TopBusinesses
Back To Top
Businesses by NAICS
| Category | Number |
|---|---|
| Total Businesses | 8,302 |
| Agr/Forestry/Fish/Hunt Bus | 47 |
| Mining Bus | 3 |
| Utilities Bus | 12 |
| Construction Bus | 699 |
| Manufacturing Bus | 272 |
| Wholesale Trade Bus | 154 |
| Retail Trade Bus | 1,025 |
| Motor Veh/Parts Dealers Bus | 124 |
| Furn & Home Furnish Str Bus | 61 |
| Electronics & Appl Store Bus | 34 |
| Bldg Matl/Garden Equip Bus | 84 |
| Food & Beverage Stores Bus | 148 |
| Health/Pers Care Stores Bus | 104 |
| Gasoline Stations Bus | 80 |
| Clothing/Accessory Store Bus | 70 |
| Sports/Hobby/Book/Music Bus | 251 |
| General Merchandise Str Bus | 69 |
| Transportation/Warehouse Bus | 143 |
| Information Bus | 161 |
| Finance & Insurance Bus | 348 |
| Cntrl Bank/Crdt Intrmdtn Bus | 139 |
| Sec/Cmdty Cntrct/Oth Inv Bus | 110 |
| Insur/Funds/Trusts/Other Bus | 99 |
| Real Estate/Rent/Leasing Bus | 438 |
| Prof/Scientific/Tech Srv Bus | 845 |
| Legal Services Bus | 172 |
| Mgmt of Comp/Enterprises Bus | 11 |
| Admin/Support/Waste Mgmt Bus | 295 |
| Educational Services Bus | 244 |
| HealthCare/Social Assist Bus | 1,038 |
| Arts/Entertainment/Rec Bus | 184 |
| Accommodation/Food Srvcs Bus | 660 |
| Accommodation Bus | 51 |
| Food Srv/Drinking Places Bus | 609 |
| Other Srv excl Pub Admin Bus | 1,128 |
| Auto Repair/Maintenance Bus | 179 |
| Public Administration Bus | 235 |
Source: ESRI, 2024-09-18
Back To Top


.png)

.png)


.png)